| Wastewater | Deer Island, Boston Harbor - Page 21 |
| As executive director Robert Levy would hear it continuously, and it would be no different for the new director Douglas MacDonald. Even today, like clockwork when new water and sewer bills come out the complaining begins again, why are my water and sewer bill so high? Levy had explained the reason clearly just four months after getting the job, |
| “…We have to tell people they’ve been underpaying for years, and we’ve been polluting… not a very satisfactory explanation, but it’s true….” |
| That was a very blunt, though accurate assessment. In the future he and other MWRA officials would soften the message and instead explain the higher bills by offering, depending on the audience, the appeal of having a clean harbor to enjoy, the court ordered requirement to do it, or the wisdom of doing it now because it would cost a lot more doing it in the future. Nevertheless, it was true, the people of the Boston metropolitan area had been underpaying the cost of environmentally sound wastewater disposal for years. |
|
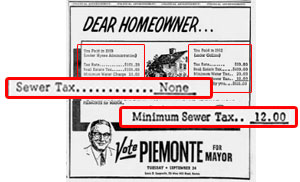
To understand how much people had been underpaying the city of Boston, by far the largest consumer of water and largest producer of wastewater in the metropolitan area, is a good example. Remarkably, before 1961 Boston households paid nothing for sewage disposal. In that year Boston mayor John F. Collins implemented a minimum $12 a year fee per household for sewage disposal. Political opponents pounced calling it a new tax with some claiming it illegal because it forced homeowners to pay twice for water, coming in and going out. The fee was reduced to $6. In the early 1960s the annual cost of water for an average family was in the $20-$38 range. In 2022 dollars, between $190 and $355. |
| For the MDC in the 1960s the problem had not been the sewerage system, a new albeit problematic Deer Island treatment plant had just gone into operation. The problem was a record setting drought. There was talk of the Quabbin reservoir running dry and plans were drawn up, but never implemented, for taking water from the Connecticut River. The average annual cost of water for a Boston resident in the early 1970s comes from a story in the Boston Globe (July 17, 1972) about the water shortage crisis. The paper published EPA figures on the average cost a family paid for water in cities and towns in the Greater Boston area. Water in Boston cost on average $73.20 a year, one of the highest in the area, Arlington at $37.24 had one of the lowest costs. |
| There would be little in the way of detailed reporting on water and sewer bills for individual towns in the Boston metropolitan area until the MWRA comes into the picture. Their initial estimates of the average homeowner’s water and sewer bill in the early 1980s was in the $190 to $210 range. Factoring in inflation, that cost Is almost exactly the same what it was ten years earlier and only marginally more than it was in the 1960s. The harbor was polluted, the existing sewage treatment plants were inadequate and unreliable, and the MDC unable to convince legislators to pay for plants was $36 million in debt ($400 million in today’s dollars) Homeowners were effectively paying no more for water and sewer then than had been 30 years earlier. Levy might have been too candid when he said people had been unpaying for years, but he was not wrong. |
|
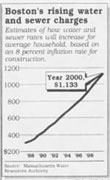
To the credit of the MWRA, starting under Levy, the agency never took the path of political expediency by underestimating the likely cost of the project they were undertaking. In fact, they did the opposite. In the same 1987 article where former MDC customers were reprimanded for not paying enough, they were warned they would be paying substantially more in the future. Paying on average $200 a year, people receiving water and services from the MWRA were informed that by 2000 they could expect to pay over $1,100 year. The total cost of the project was expected to reach over $6 billion, this when the total Massachusetts state budget had just topped $10 billion. Few ratepayers in 1987 would have considered it good news to learn that they wouldn’t see the $1,100 a year rate until 2008. |
| Transparency without clarity |
Top |
| The MWRA Advisory Board can take much credit for being a “constructive critic” of the MWRA working “diligently to advocate for ratepayers and communities” and clearly their efforts have benefited ratepayers. If there is a criticism of the board it is that until recently, and now only partially, have they provided any real clarity on how the water and sewer rate in individual communities are calculated. The result of this has been that the MWRA has received pretty much all the blame for increases in water and sewer rates. It is true the MWRA has steadily raised water and sewer rates, but what is also true is that the cost charged to a community for that water and sewer services provided by the MWRA makes up in many cases only half of total amount ratepayers see in their bills. |
|
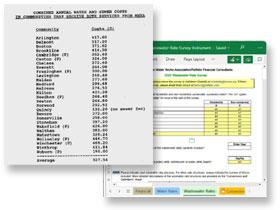
The MWRA Advisory Board took a first step towards providing some transparency on water and sewer rates in 1988 when it published the average water and sewer bill for each of the 60 communities receiving any or all their water and sewer services from the MWRA. They did this by borrowing a technique developed by George A. Raftelis at Arthur Young & Co. (Ernst & Young following a merger). Starting in 1986 the accounting firm had sent surveys to utilities across the country asking about the characteristics of their systems, their finances, and what would be the costs of water and wastewater for an average family using 90,000 gallons of water per year. Demand for this information was high and has stayed high with the survey being repeated every two years. It is now performed by the consulting company Raftelis founded in 1996. Done in junction with the American Water Works Association (AWWA) over 2,000 water and 100 wastewater utilities across the country are benchmarked. Similar surveys are also now done by the consulting companies, Black & Veatch, Tighe & Bond, Bluefield Research, and the EPA. |
| To most people paying their water and sewer bill is just like paying any another utility bill, for example the electric bill. The electric utilities are highly regulated by a state agency – formerly lead by former MWRA Director Robert Levy – and that same average family living in any of the communities serviced by the same utility company using the same amount of electricity could expect to be charged the same for the service. It might not be clear why there are charges added on for energy efficiency, electric vehicles, distributed solar, or renewable energy, but they are at least identified on the bill and consistent across communities. |
The MWRA charges Boston and all communities a simple flat rate for water - based on meter readings. There are no meters to measure sewage flow, so the bill for sewage is a calculation based on total flow, census population, and operating costs. Theoretically if it was the MWRA sending out the bills for water and sewer all the average households in all the twenty-one communities receiving the same water and sewage service would be charged the same amount. But unlike other utilities, water and sewer bills do not come from a private company or a state institution, they come from a department in the local community.
When the MWRA Advisory Board published the results of their 1988 survey it showed that not one of the average ratepayers in any the 60 communities serviced by the agency paid the same for their water and sewer. Only twenty-one communities used the MWRA exclusively for both their water and sewer. The rest used the MWRA for a mix of services, some only for water, some only for wastewater, some partially for each, and some only in emergency. That would explain different rates in those communities. But not in the twenty-one communities that used the MWRA exclusively. |
|
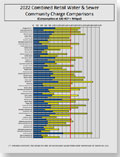
If the model used by electric companies applied the average ratepayer in the twenty-one communities should all see the same water and sewer bills. That was not and still is not the case. In Belmont in 1988 that average family using 90,000 gallons of water would have received a bill for $385.20, $157.20 for water and $228.00 for the sewer. That same average family in Everett, using the same amount of water, had to pay only $192.00 for the year, $96.00 for the water and $96.00 for the sewer. In 1988 in Quincy that average family paid only $124.80 for water and nothing for their sewer. The average ratepayer in each of twenty-one communities were charged differently for the same water and sewer service. Jumping forward to the 2021 MWRA Advisory Board survey and the disparity still exists. The average ratepayer in Everett received a water and sewer bill for $1,084.80. The bill for same service in Winthrop was $2,838.00. |
| Comparing local water and sewer bills provides little insight. It is likely not an exaggeration that every community calculates how it charges for water and sewer differently. Among just the communities that receive both water and sewer service from the MWRA some have minimum charges, others base charges, different step charges (ranging from two to six) for higher volumes (to encourage conservation), or different charges based on incoming water meter pipe size. All have different rates for water and sewer usage, all except Winthrop which might be setting a trend by recently adopting a rate consisting of a base $50.00 charge and one combined rate for both water and sewer. That’s just the water and sewer rates. Communities have different accounting methods including using general funds, special revenue funds, or enterprise funds. Some finance a portion of the costs the debt service by shifting it to the property tax base. Boston remarkably had kept its average rate and sewer rate at $650.10 from 1993 to 2001 giving credit to cutting administrative costs, fixing leaks and installing more accurate water meters. It would be foolish to think that politics did not play a role in how the rates were calculated. |
| The MWRA has always admitted to being the primary reason rates have gone up. It has also never commented on how its member communities calculate their water and sewer bills. In fact, they have been a source of no-interest loans communities can tap for system improvement. However, in the interest of clarity, the MWRA has not hesitated in setting the record straight on what its share is of the average water and sewer bill. In a fall 1992 brochure titled, Rate Relief, A Periodic Report from the MWRA, the agency made it clear that, |
| “The bill you get from your community includes costs of both the MWRA regional system and the expenses for the operations, maintenance and rehabilitation services provided by your city or town. Rates and billing frequency vary from community to community.” |
| The MWRA’s own estimate in 1992 was they were responsible for two-thirds of the average ratepayers’ bill. The average water and sewer bill then was $534.00. The cost of water was $176.00 with $75.00 the MWRA’s share, or 43%. The average sewer portion of the bill was $358.00 with the MWRA’s share much higher at $280.00, or 78%. |
| The agency would stick with the two-thirds share number until 2011. With apparently no fanfare or even mention in the press, the MWRA reduced what it calculated its’ share of the overall average water and sewer bill to 45%. The average annual water and sewer bill in 2011, according to the MWRA Advisory Board, had risen to $1,298.00. Using the MWRA’s new estimate, its share of the average bill would be $584.00, up 65% from 1992. The portion of the average ratepayer’s water and sewer bill that went to local communities had almost tripled to $712.00. |
| It wouldn't be until 2014 before the MWRA Advisory Board began to publish any information on what the MWRA’s charges were as a portion of the total amount consumers paid. The precision of the reporting was minimal. Options were, 25%-50%, 50%-75%, or over 75% of the total bill. No overall averages were published. Any more information on what local communities were doing with their share of water and sewer bill is almost non-existent. |
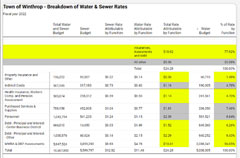
On rare occasions a community will publish how its spending its share of the water and sewer bill. Waltham posted a document in 2022 that showed its MWRA assessment was 67% of its total water and sewer costs. Maintenance and operations and debt service made up the next two largest costs. Winthrop provided a much more detailed breakdown of where the money collected from water and sewer was going in 2022. MWRA charges were the highest at 56%. Other costs included personnel, health insurance, workers compensation, pension assessment, purchased services and supplies, insurance and debt. An examination every community should provide on a regular.
The MWRA Advisory Board is not to blame for the limited accounting of its local community’s operations. Their charter has always been to provide transparency on the operations of the MWRA, it has never been to provide clarity on workings of the water and sewer departments of the member communities. However, in the over 35 years that the MWRA has received bad press over rising water and sewer rates, one would be hard pressed to find an example where the civic leaders of a community have accepted any of the blame. |
|
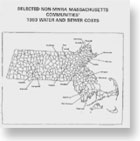
In its 1993 Water & Sewer Retail Rate Survey the MWRA Advisory Board expanded its study to include communities outside of those it served. The agency collected the same average cost for 90,000 gallons of water from 19 non-MWRA communities in Massachusetts and 24 cities across the country. In that year the average cost for communities receiving all or some of their water and sewer treatment from the MWRA was $556.26. For communities receiving both the average was $599.83. The average for the 19 non-MWRA communities was $394.31. Only Gloucester at $916.00 had much higher average water and sewer bills than any MWRA or non-MWRA community. |
| Gloucester had been one of the few Atlantic coast communities in 1985 to receive a temporary 301(h) waiver. Instead of a secondary treatment plant a permit from the EPA required the community to build a Chemically Enhanced Primary Treatment (CEPT) plant, the technology MIT professor Harleman had proposed for Boston, extend their outfall to 2.8 miles into Massachusetts Bay, and eventually upgrade the plant to secondary treatment. The $916.00 rate in 1993 might have been a reporting error because the following year the average bill was $650.70 and would remain nearly flat until 2000. Nevertheless, Gloucester’s average water and sewer bills have remained higher than the MWRA’s to this day. The community has faced many challenges, discharges from fish processing plants would overwhelm the sewage treatment plant’s capacity, even in dry weather there were sewer overflows, widespread granite rock ledge made septic systems problematic and replacing them with sewer pipes very expensive, the sewage treatment itself is not far above rising ocean levels, and the EPA is pushing to have the plant upgraded to secondary treatment. Other Cape Ann face similar problems and have similar above MWRA average water and sewer bills. |
| More rate comparisons |
Top |
|
In 2019 the MWRA Advisory Board increased its reporting on the average water and sewer bills from communities in Massachusetts not served by the MWRA to over 100. A very thorough effort but really of little practical use. While functionally the service is the same – water from a tap, sewage down a drain – for non-MWRA communities that is about where the similarity ends. Boston metropolitan officials had the political clout to create a supply water by seizing and flooding two valleys outside of the metro area first creating the 65-billion-gallon Wachusett Reservoir at the end of the 1800s, then in the 1940s the 400-billion-gallon Quabbin Reservoir. Fifty years later they solved their wastewater problem by building a multi-billion-dollar sewage treatment plant. Non-MWRA communities had make do for water from wells and treated rivers, and septic systems and small sewage treatment plants. |
|
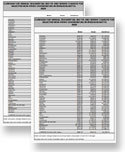
The MWRA Advisory Board’s Water & Sewer Retail Rate Survey included big cities on the east coast including, New York, Newark, Philadelphia, Washington, D.C., Jacksonville, Fla., and nearby and smaller Providence, R.I. and Portland, Maine. The midwestern cities of Detroit, Saint Louis, Columbus, Indianapolis, Saint Paul, and Milwaukee were included. Texas was well represented including, Dallas, Fort Worth, Austin, and Houston along with New Orleans in Louisiana. In the west it was Los Angles, San Jose, San Francisco, San Diego. And then finally way west, Honolulu. To the credit of the MWRA and its Advisory Board the information in the 1993 survey was in no way good news. The average combined water and sewer bill among MWRA’s communities in 1983 was $558.26. Only Portland, Maine’s rate of $559.08 was higher. Citizens in every other city in the country paid less in their water and sewer bills. |
| Eight years later in 2001, with Deer Island Treatment Plant in full operation Seattle had joined Portland with rates higher than the MWRA average of $751.41. San Diego and San Francisco were close behind. Jump forward ten years and in 2011 both cities have water sewer rates higher than the MWRA average of $1,298.16, and now also Honolulu had joined the list. In 2021 New Orleans and Washington, D.C. join the list of cities with more than the MWRA average of $1,760.00, with the rates of San Jose, Los Angeles, and Austin close behind. |
| Other recent national surveys of water and wastewater bills place Boston’s rate similarly in the higher tier of cities, though lower than Baltimore, San Francisco, Seattle, and Washington, D.C. Cities on the coast or major coastal bays are some of the highest, possibly following Boston by finding discharge into the ocean too easy a solution. Among the cities with the lowest rates, Milwaukee, the first city to convert sludge to fertilizer, Memphis, one of the first cities with a two-pipe system separating storm water runoff from wastewater, and Phoenix, because of need an early adopter of re-use of treated wastewater. Like comparisons of water and wastewater bills in Massachusetts, comparisons on a national level tell an interesting story but are similarly of limited value. |
| During the long construction phase of the Boston Harbor Project, and even today, one would be hard pressed to find an MWRA customer that didn’t think the region got the short end of the stick when it came to the federal government helping to pay for the project. The argument being, shouldn’t the Federal Clean Water Act have provided more money? The fact that the act was passed in 1972, and that the MWRA wasn’t formed to tackle the cleanup until 1985, when funds were winding down, and that the communities in region had made almost no investment to clean up the harbor to that point, is conveniently forgotten. |
| Not everybody holds the opinion that MWRA rate payers got a bad deal from the federal government. In 1985 letter to the Boston Globe, Rhode Island’s Republican Senator John Chafee accused Massachusetts officials of looking to the federal government for a pork barrel buyout of the cost of the project. As noted before, he was correct in saying that Boston got off to a late start. He played a game of using non-inflation dollars to say that the federal government had already given $2 billion to the state to improve wastewater treatment facilities. If true, every other community in the state must have state-of-the-art treatment facilities. And it rings disingenuous to hear criticism from a Senator of a small state that proportionally receives a significantly higher percentage of federal funds than Massachusetts. |
| To hear criticism from a politician of a rival party and neighboring state is to be expected. It rings truer when its from noted author Eric J Dolin in his comprehensive 2008 book, Political waters: The long, dirty, contentious, incredibly expensive but eventually triumphant history of Boston Harbor - A unique environmental success story. He maintains that the federal money was distributed fairly, and that Massachusetts did receive their share and likely small cities and town did reap some from Boston not receiving the money. But he says it’s impossible to know what would have happened had Boston not stalled by attempting again and again to get a 301(h1) waiver. |
|